Browsing through Pinterest is always a fun thing to do. I’ve always been obsessed with color palettes that are all over the place on Pinterest, and I’m pretty sure you have come across them as well, but in case you really don’t know what I am talking about, my little board of beautiful color palettes is right here to give you an idea about it. Color palettes are aesthetic color combinations. They are quite useful, as for example web developers can use color palettes to find a thoughtful color scheme for their website.

Demo of the Color Palette Generator
Such a color combination can be created purely by heart, or a more tangible way is from a picture. The most talented will probably eye craft a palette from a picture, while the lazy and half as talented, like me, will probably end up using a website that does the generation for me - using some AI magic. However, I’m a curious person too, and find joy tearing things apart, so I naturally wanted to write my own version of the color palette generator. I did that, using OpenCV, and Qt to make an easy to use graphical user interface (GUI), and I’m here to share you how I did that and how you can do it too.

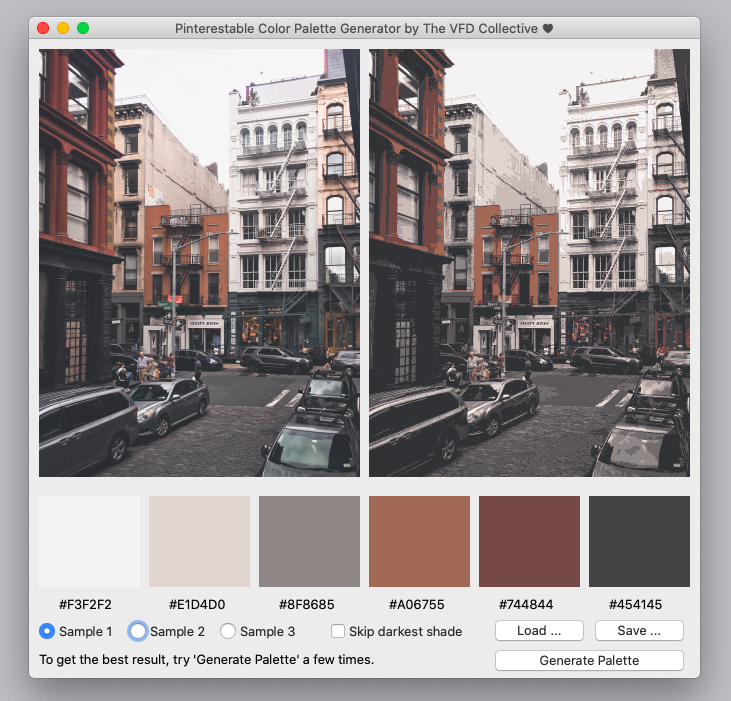
Screenshot of the Color Palette Generator by The VFD Collective in action. Left: original picture, right: “posterized” picture, bottom: calculated color palette for the picture
Before we get started
Most of the tools used in this litte project doesn’t come pre-equipped with your computer, so if you haven’t installed them before, you’ll need to install and set them up first:
Qt Open Source: https://www.qt.io/download-open-source
OpenCV: https://docs.opencv.org/master/df/d65/tutorial_table_of_content_introduction.html
As for OpenCV on macOS, use a package manager like homebrew to make installing ezpz. All you need to do now is to tell Qt that you have OpenCV installed. How this is done depends on what platform you are on. For Windows users, follow the guide in the Wiki. To the Mac users here, I found this article helpful.
The User Interface
Let’s do the easy part first. I use a simple QWidget based GUI for the color palette generator
The two images and the color rectangles are all QLabels. The image is set by QLabel::setPixmap(), the color rectangles are set by setting the background color of QLabel::setStyleSheet()
The three QPushButtons trigger the action. A picture is loaded using the ‘Load’ button and by clicking ‘Generate Color Palette’, the posterized image (that’s an intermediate step) and the resulting color palette is generated. Use ‘Save’ to export the picture plus its palette to disk
When a picture is loaded, the main app window is automatically resized to the size of the picture
If no picture is selected, three sample pictures can be used
So how do we get the color palette? The idea
If you’re just here for the real tofu (meat is so 20th century) and see the code that actually does the calculation, skip this section. Otherwise, read on. You might know that a picture is made up from quite a bunch of pixels. On an RGB image, three color components red, green, blue add up to a single pixel. A picture with a resolution of 1024 * 768 has 786 432 individual pixels and 2 359 296 colors!
I. A naÏve Approach
So if we want to see what colors are represented in our image, we can split it evenly into, say, 6 parts if we want a palette with 6 colors. Then we just go through every pixel in each of the six parts, add them up and divide by the number of pixels to get the average color. Simple, right? For a picture with one dominant color and a clear gradient it works pretty well, but in general, this is a very naïve approach. What we often end up with are wishy-washy colors, because as soon as we have two or more dominant colors in one part, they’ll simply get mixed together. That’s ugly and not what we want.

Averaging plus some weighting is used in myOpenVFD to calculate ambient light colors. As you can see, it works well for a single dominant color picture with a distinct gradient from light to dark purple
II. We can do much better: K-means clustering
Our naïve averaging approach wasn’t awful, it was just a bit flawed. Turns out we can still average, but in more intelligent way so that we try to grab the dominant colors and average over them. And that’s what K-Means clustering roughly does. K-Means clustering divides our image into K groups ‘clusters’. The clusters are calculated so that the pixels that belong to that cluster are most likely similar to each other. Each cluster has a center color, which is the average color of the whole group

K-Means clustered image with k = 6
Here’s an example picture. The right image shows the result after running the K-Means algorithm with K = 6 followed by clustering. You can tell that it reduced the left image into just six dominant colors: The houses in white, red and orange, and the street in dark and light gray, and black for the coffee package. We can call the color reduced image the posterized image because it somehow reminds of vintage route 66 posters.
So how do we get the color palette? The Code
I. K-Means Clustering
Qt and OpenCV use different ways to represent an image. So a significant amount of code is actually used to convert between the two different representations and don’t add up to the actual functionality. I will replace these parts by pseudocode. You can always find the full code on my GitHub account, the link to this repository is down below.
cv::Mat source_img = // Read image from path

// Serialize, float
cv::Mat data = source_img.reshape(1, source_img.total());
data.convertTo(data, CV_32F);

// Perform k-Means
int k = 10;
std::vector<int> labels;
cv::Mat3f centers;
cv::kmeans(data, k, labels, cv::TermCriteria(), 1, cv::KMEANS_PP_CENTERS, centers);
The first chunk of code reads the image from file, and makes it ready for K-Means. This is done by converting our source image, which is a (height x width) dimension matrix of pixels, to a (1 x height * width) dimension matrix (row vector). Then we use a vector labels, which is gonna assign a label to each and every pixel, and a row vector centers that holds the k center colors.
// Make a poster! (Clustering)
for (int i = 0; i < (int)labels.size(); ++i) {
    data.at<float>(i, 0) = centers.at<float>(labels[i], 0);
    data.at<float>(i, 1) = centers.at<float>(labels[i], 1);
    data.at<float>(i, 2) = centers.at<float>(labels[i], 2);
}

// Un-Serialize, un-float
cv::Mat destination = data.reshape(3, source_img.rows);
destination.convertTo(source_img, CV_8UC3);

// Display poster
If we just want the color palette, then we are done and we can move on to the next step. But if we want to see our posterized image, we need to apply the result of K-Means to our image. This is done by assigning a pixel that belongs to a certain center color, for example ‘brick red’ and ‘wine red’ to the center color ‘red’. Remember to un-serialize the image if you’d like to display the poster.
II. Let’s make it prettier

Now we got our k center colors after running K-Means, and suppose we have 10 of them, but we only want a palette of 6 colors. One way to map 10 center colors to 6 colors of our palette is to take the 6 colors that occur most frequently. A simple histogram can do the job.
Often however, unique colors with small occurrence are lost this way and instead of capturing the gold of the sun, you get 6 boring shades of dark blue. So how about finding the most unique colors instead? Uniqueness can be seen as how distant a color is from all other colors. We can thus find the colors that are least distant from each other and remove them one by one. I’ll spare you the code, because the syntax is a pain in the ass given our data types. It’s just three cheap for loops, one to remove the center, and two other to calculate the distances.
For our final palette we’d like to get a pleasant gradient. We can obtain this by ordering them by brightness.
std::sort(centers.begin(), centers.end(),
        [](const cv::Vec3f &a, const cv::Vec3f &b) -> bool
        { return a[0] + a[1] + a[2] > b[0] + b[1] + b[2]; }
    );
This code snippet above sorts the center colors by comparing the total energy of the pixel - a sum over the red, green and blue component.
III. Shining up to the sky
Finally we can make the color palette even more interesting by removing the lightest and darkest shade. Of course this depends on the image, but in general, pure white and pure black are unwanted in our color palette, because they don’t reveal relevant information. Simply add an offset to the sorted centers.
Time to put the colors on show. To make the labels b1 … b6 show our 6 colors, we need to assign the colors of our centers to the background color of them. Time to set the stylesheet!
// Paint!
QLabel *palette[6] = {ui->b_1, ui->b_2, ui->b_3, ui->b_4, ui->b_5, ui->b_6};
const int p = 0; // Offset
for(int i = 0; i < 6; ++i) {
    // Set back color of label. Lazy ass way to show the colors
    std::stringstream back_clr;
    back_clr << centers.at<float>(i + p, 0) << "," << centers.at<float>(i + p, 1) << "," << centers.at<float>(i + p, 2);
    palette[i]->setStyleSheet(QString::fromStdString("background-color:rgb(" + back_clr.str() + ");"));
}
A Compiled version
If you’re a macOS user, it’s your lucky day, and I have compiled the Color Palette Generator for you so that you can run it from your computer directly. For other platforms, you need to compile yourself - because I’m quarantined at home and my Windows computer is in the #VFDCo Studio in the city center.
Color Palette Generator
with ♥ by The VFD Collective
File Format: dmg-File, 33.9 MB
Due to static linkage of the OpenCV library, the app ended up larger in size than I’ve expected it to be.
GitHub Repo and Further Reading
This article is inspired and loosely based on: https://medium.com/@andrisgauracs/generating-color-palettes-from-movies-with-python-16503077c025
With basics of K-Means explained here: https://www.pyimagesearch.com/2014/05/26/opencv-python-k-means-color-clustering/

